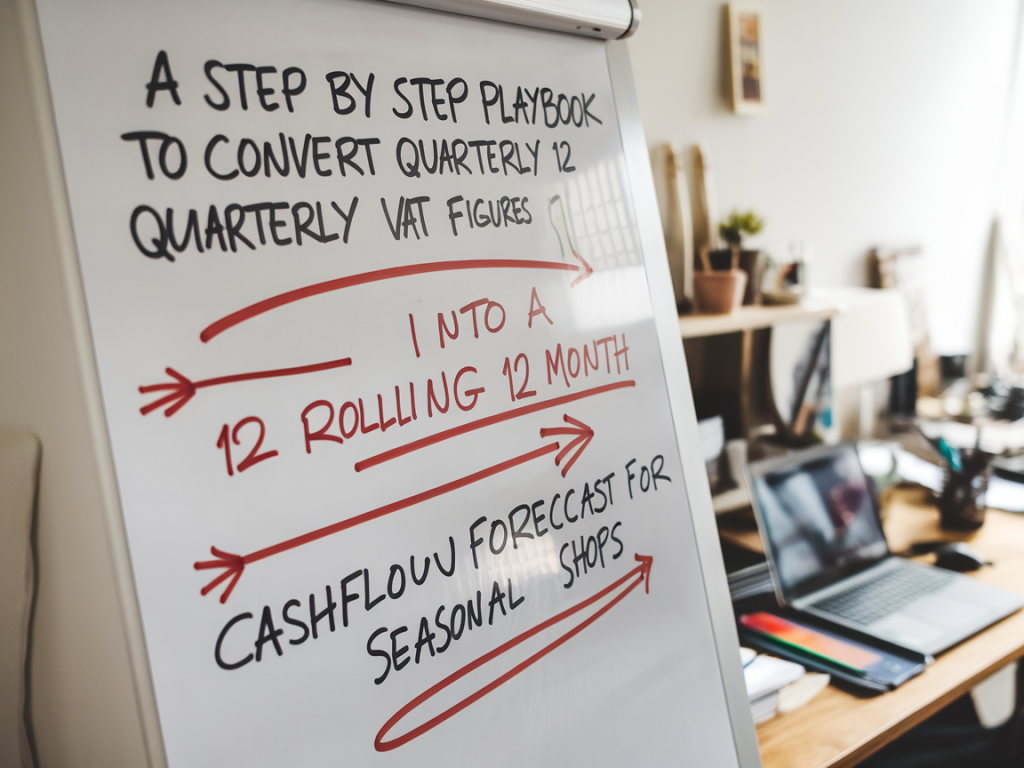
Seasonal shops live on cycles — big peaks, quiet troughs, and VAT returns that arrive every three months like clockwork. For many owners I work with, quarterly VAT figures feel like a blunt instrument: accurate for tax compliance but not much help when you’re trying to smooth cashflow across the year. Over time I’ve developed a practical playbook that turns those VAT totals into a rolling 12‑month cashflow forecast you can actually use to plan staffing, stock buys and short‑term borrowing.
Why convert quarterly VAT into a rolling 12‑month forecast?
Quarterly VAT returns tell you how much tax you’ve collected and paid over three months, but they don’t show timing details — when customers paid, or when expenses hit the bank. A rolling 12‑month forecast does three important things for seasonal retailers:
I’m going to show you a step‑by‑step method that works whether you use Xero, QuickBooks, Sage, or a simple Google Sheet. If you already keep VAT totals per quarter, you have everything you need.
What I ask for before we start
When I help a client, I request these pieces of information:
Even with only quarterly VAT figures you can build a useful forecast — you’ll just make stronger assumptions about intra‑quarter behaviour if you lack monthly sales data.
Step 1 — Create a month‑by‑month skeleton
Open a spreadsheet and lay out 12 months in columns across the top (or 13 if you want a rolling view that includes the upcoming month). Down the rows, create these headings:
This skeleton gives you the building blocks for a true cash forecast, not just a VAT tracker.
Step 2 — Allocate quarterly VAT across months
Take the VAT you reported in each quarter. For example, if your Q2 VAT payable was £3,000, you need to split that amount across Apr/May/Jun. There are three ways I use, depending on data availability:
In practice I start with an even split, then refine using actual monthly takings as they appear. This gives a pragmatic balance between accuracy and speed.
Step 3 — Translate VAT into net sales and purchases
If your VAT return shows net VAT payable (output VAT minus input VAT) only, you can still reverse engineer approximate sales and purchases. Use the VAT rate you typically charge — 20% for standard items (or a mix if you have zero‑rated items).
Quick calculation examples:
These aren’t perfect, especially when you mix VAT rates, but they let you populate the “Estimated Net Sales” and “Estimated Purchases” rows and build a cash picture. If you use accounting software (Xero/QuickBooks), exporting monthly VAT reports is even easier and more accurate.
Step 4 — Add timing adjustments for VAT payments
VAT cashflow is about timing. Even if VAT is accrued monthly, HMRC is paid quarterly (unless you’re on Payment on Account or annual accounting). Two important timing items I include:
For example, sales recorded in March may not reach your bank until April or May. That movement changes when you need to have cash available to pay VAT.
Step 5 — Layer fixed and variable costs
Add your known fixed costs (rent, PAYE, utilities) to the months they hit the bank. Then estimate variable costs as a percentage of sales (e.g., 25% of net sales for cost of goods sold). This produces a more realistic monthly net cash movement.
Step 6 — Build the rolling element
Once you have 12 months populated, make the sheet rolling: when a new month finishes and a VAT return is filed, drop out the oldest month and add the new month at the front. Update allocations using actuals where possible. I like to keep a column showing the variance between estimated and actual VAT paid — that’s where learning happens.
Useful template (simplified)
| Month | Net Sales | Output VAT | Purchases | Input VAT | Net VAT | VAT Payment | Closing Cash |
|---|---|---|---|---|---|---|---|
| Apr | £6,000 | £1,200 | £1,500 | £300 | £900 | £900 | £3,200 |
| May | £4,000 | £800 | £1,000 | £200 | £600 | — | £2,900 |
| Jun | £5,000 | £1,000 | £800 | £160 | £840 | £1,740 | £2,160 |
This mini table shows how VAT payable moves into the VAT Payment column depending on quarter timing. The Closing Cash column is the running bank balance after all receipts and payments.
Practical tips I give clients
How I check my work
Each quarter I compare the forecasted VAT to the actual VAT on the return. If there’s a consistent variance, I investigate: mixed VAT rates, big supplier invoices, or timing differences in customer payments are usual culprits. Fixing categorisation in the bookkeeping system usually closes most gaps.
If you’d like, I can share a Google Sheets template I use with clients so you can plug your quarterly VAT numbers in and see a 12‑month rolling forecast instantly. It’s made to be pragmatic — not perfect — and to get you making operational decisions with confidence instead of reacting to unexpected VAT bills.